Statisticshelpdesk Blog Posts

Simple Guide on Creating Plots and Graphs for Minitab Assignment Help

Button Image
Simple Guide on Creating Plots and Graphs for Minitab Assignment Help

Minitab is a powerful statistical software widely used by students, researchers, and professionals for data analysis. Academia has adopted SPSS because of its interface and capability for analysis hence making it a good tool in statistics education. It is not only beneficial for students in conducting data analysis in their course assignments but it also finds application in the manufacturing sectors, healthcare, and the financial sectors for quality improvement and making decisions. Additionally, it covers all sorts of robust statistical procedures and graphical visualization tools useful for finding insights and presenting data. In this guide, we will provide detailed information on how to create plots and graphs in Minitab for students seeking minitab assignment help.

Minitab Overview

Minitab comes equipped with a set of analytic tools such as basic statistics, regression, ANOVA, control charts and time series among others. It has great data visualization features, which enables the user to generate insightful plots and graphs making it easier to interpret data and results. These visualization skills are critically important while working on assignments, projects or presentations.

Why Graphs and Plots are Important in Data Analysis

Graphs and plots are pictorial presentations which are used in explaining various aspects of large data set to derive meaningful insights. They help in finding the critical elements within data including underlying patterns, trends, and presence of outliers. These visualization skills are highly important in making your data analysis reports visually appealing and communicating a holistic picture of data. Such plots and graphs are commonly used in business reports to have a comprehensive view of changing patterns and trends over a period of time.

Getting Started with Minitab

Before diving into creating plots and graphs, let us familiarize ourselves with the Minitab interface:

  1. Project Manager: presents a branch view of all the worksheets, output, and graphs in the current project.
  2. Session Window: displays text output, such as the results of analyses.
  3. Worksheet: The area where you add and manipulate your data.
  4. Toolbar: Provides quick access to common tasks and functions.

Step-by-Step Guide to Creating Plots and Graphs in Minitab

To generate a plot or graph in Minitab, one has to work with a data set in the worksheet initially. This guide will use a sample data set in csv format refer to as customer_satisfaction.csv that holds the customer satisfaction ratings for a particular product along with the product age and price of the product. Let us explore the steps to create various plots in minitab using the data below.

Product Age (Months)

Price ($)

Satisfaction Rating (1-5)

12

299

4

24

349

3

36

399

5

48

449

4

60

499

2

72

549

3

84

599

1

96

649

2

108

699

4

120

749

5


Importing Data into Minitab
Step 1: Open Minitab.
Step 2: Go to File > Open Worksheet.
Step 3: Navigate to the location of your data file and select it.
Step 4: Click Open to import the data into Minitab.

Minitab Plots:

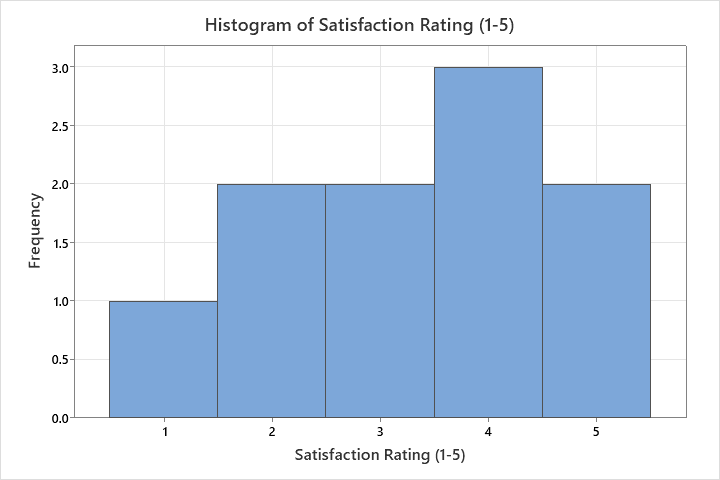
Histogram:

  • Graph > Histogram
  • Select “Satisfaction Rating” as the variable. 
  • Customize bin width, labels, and title as needed.

minitab histogram help

Bar Chart:

  • Graph > Bar Chart
  • Select “Product Age” as the categorical variable and “Satisfaction Rating” as the numerical variable.
  • Customize chart appearance.

Pie Chart:

  • Graph > Pie Chart
  • Select “Product Age” as the categorical variable.
  • Customize chart appearance

Scatterplot:

  • Graph > Scatterplot
  • Select “Price” as the X-variable and “Satisfaction Rating” as the Y-variable.
  • Customize plot appearance, add a trendline if needed.
scatterplot minitab homework help

Matrix Plot:

  • Graph > Matrix Plot
  • Select “Product Age”, “Price”, and “Satisfaction Rating” as variables.
  • Visualize relationships between all pairs of variables.

Time Series Plots:

  • Graph > Time Series Plot
  • Select “Product Age” as the time variable and “Satisfaction Rating” as the value variable.
  • Customize plot appearance, add trend lines or seasonal components.

Box Plots

  • Graph > Boxplot
  • Select “Satisfaction Rating” as the variable.
  • Group by “Product Age” or “Price” to compare distributions.

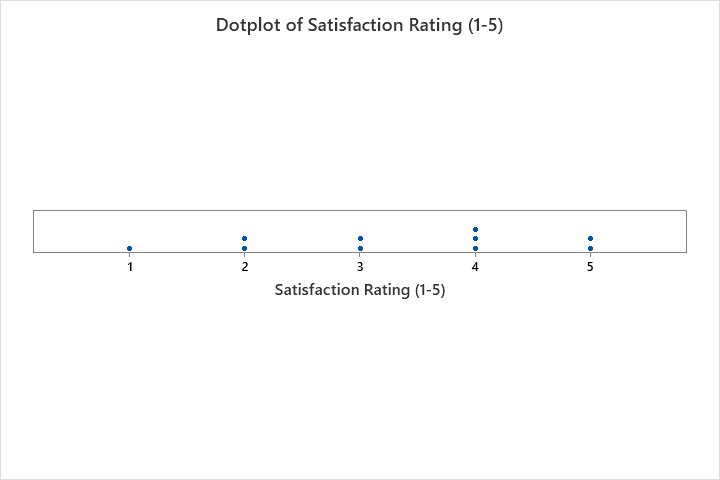
Dot Plots:

  • Graph > Dotplot
  • Select “Satisfaction Rating” as the variable.
  • Visualize individual data points.
dotplot minitab visualisation

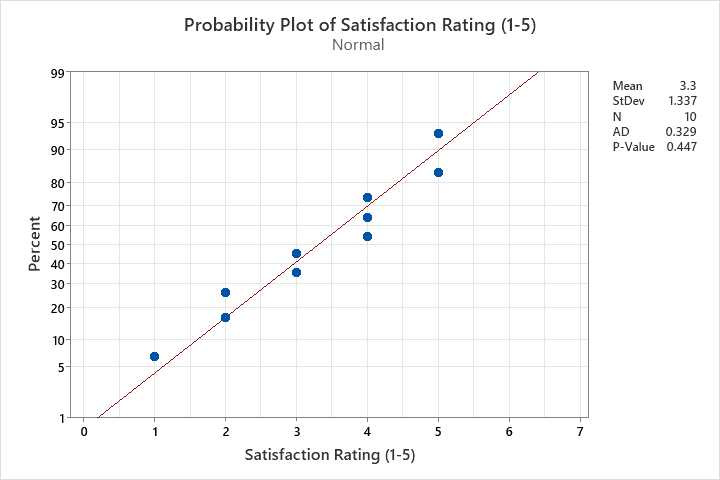
Probability Plots:

  • Stat > Basic Statistics > Normality Test
  • Select “Satisfaction Rating” as the variable.
  • Check if the data follows a normal distribution.
how to make probability plot in minitab

QQ Plots:

  • Stat > Basic Statistics > Normality Test
  • Select “Satisfaction Rating” as the variable.
  • Compare the quantiles of your data to the quantiles of a theoretical distribution.

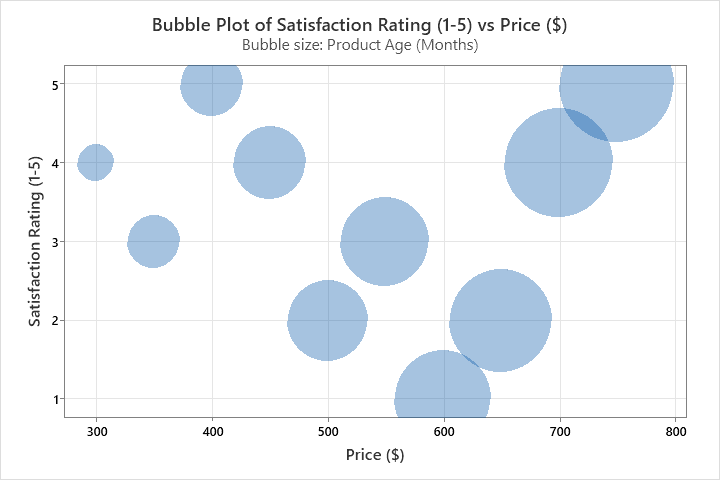
Bubble Plots:

  • Graph > Bubbleplot
  • Select “Price” as the X-variable, “Satisfaction Rating” as the Y-variable, and “Product Age” as the bubble size.
  • Visualize relationships with size representing a third variable.
how to make bubble plot in minitab assignments

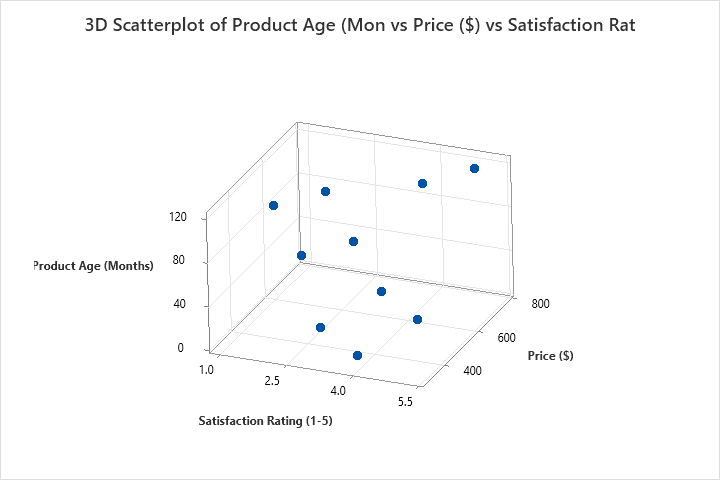
3D Plots:

  • Graph > 3D Scatterplot
  • Select “Product Age”, “Price”, and “Satisfaction Rating” as variables.
  • Visualize relationships in three dimensions.
how to make 3d scatter plot in minitab

Minitab Assignment Help: Why you must opt for it?

Even though there are thousands of tutorials and video lessons available, students often find themselves stuck in challenging assignments questions based on Minitab. Our specialized Minitab Assignment Help service offers excellent services in solving your minitab assignments that requires advanced methods and complex big data analysis. We are aware of the fact that comprehending and implementing the concepts of statistics and their application in Minitab can be a difficult task for many of the students. This is where we step in to offer specialized services that will cater to the specific assignment requirements to produce high quality assignments having accurate analysis and clear interpretation.

How We Solve Complex Minitab Analysis Problems

Our team consists of experienced statisticians and data analysts who are proficient in using Minitab for a wide range of statistical analyses. Whether it’s conducting a simple t-test or performing a complex regression analysis, our experts meticulously handle each problem with precision and expertise. Here is how we approach complex Minitab assignments:

  1. Understanding the Problem: To ensure that our work meets the required standards, we first begin by analyzing the instructions, learning outcomes and rubric outlined by the instructor on the assignment. This includes type of analysis that the data requires, methodologies to be used and the specific questions to be answered.
  2. Data Preparation: If needed, data cleaning and data pre-processing is done to prepare our data for analysis. This step involves the assessment for missing values, outliers as well as any other issues that will impact analysis.
  3. Choosing the Right Analysis: Statistical tests or models are chosen according to the specifics of the given assignment and the characteristics of the data acquired. It may be ANOVA or regression, chi-square tests or time series analysis, we make sure of the proper technique to be used.
  4. Performing the Analysis in Minitab: Latest version of minitab with up-to-date capabilities is employed to carry out the analysis for generate accurate results.
  5. Interpreting the Results: Interpreting the results is one of the critical steps of data analysis that need to be done accurately. Our experts provide a thorough explanation of the results so that you can understand what the data are portraying. We make sure that the interpretations are comprehensive and in-line with the research questions and objectives of the assignment.
  6. Creating Visual Representations: Visual presentations of data in the form of graphs and plots are highly essential to portray hidden patterns and trends. To present our findings, Minitab allows us to produce clear and accurate diagrams and graphs including histograms, scatter plots, box plots, etc. These visuals are not only appealing but also helpful in finding insights for making decisions, hence making your assignment unique and outstanding.
  7. Detailed Reporting: Finally, we compile all the findings, interpretations, and visualizations into a comprehensive report. This report is crafted to meet academic standards, including formatting in APA style where required.

Why Choose Our Minitab Assignment Help Service?

Our Minitab homework support solution comes with assured grades and promises to improve your understanding of statistical concepts and minitab application. Here are some of the best features of our Minitab assignment help service:

  • Comprehensive Outputs: We provide all necessary outputs from Minitab, including statistical tables, summary statistics, and detailed analysis results. This helps you to have all the details to support your interpretations and conclusion.
  • High-Quality Plots and Graphs: We use the most appropriate visualization tools to demonstrate the nature and characteristics of data. These visuals are extremely important to help convey your findings in the best and easier manner.
  • Detailed Interpretations: Each analysis accompanies elaborated summaries that explains the findings in an easy-to-understand manner.
  • APA-Formatted Reports: All our papers are written in APA format including in-text citations and references. This ensures that the assignment submitted meets all the basic academic standards.
  • Editable Minitab Files (MTW): In addition to the report, we provide Minitab (. mtw) used in the analysis. This enables you to have a look at the analysis steps and make changes if necessary.

Conclusion

Creating plots and graphs in Minitab is simple yet impactful for improving data presentation and interpretation. This tutorial has provided a thorough guide on generating various plots and graphs, complemented by practical examples to provide you with a hands-on experience. For assistance with advanced topics such as inferential statistics, quality control, and multivariate analysis, consider our Minitab homework support service. Do not let complex data challenges hinder your progress. Our experts are here to support you in achieving top grades. Contact us today to discover how we can help you excel in your coursework.

Additional Resources

For students eager to enhance their understanding of data analysis with Minitab, here is the recommended textbook:

  • Minitab Manual for the Triola Statistics Series by Mario F. Triola – A comprehensive guide on using Minitab for various statistical analyses.

05-Sep-2024 11:37:00 | Written by Salvador
SUBMIT HOMEWORKGET QUOTE
  • Submit your homework for a free quote
  • Name:*
  • Email:*
  • Phone/Whatsapp:*
  • Subject:*
  • Deadline:*
  • Expected Price($):*
  • Comments:*
  • Attach File: (Attach zip file for multiple files)*
  • Captcha:*